WHAT HAPPENS NEXT TO HOME PRICES?
- Since 1981, prices have posted monthly year-over-year increases of 20% or more 46 times.
- An acceleration in prices is generally followed by a reversion of growth back to its long-run average within 12 months.
- In a number of periods, price growth has turned negative within 24 months, though generally following a significant external shock.
Home prices in the Real Estate Board of Greater Vancouver (REBGV) area accelerated over the past year, even exceeding 20 per cent year-over-year growth in each of the first three months of 2016. Given already high prices, in particular for single-detached homes, that rapid acceleration in prices prompts the obvious question of what happens next?
A recent report, looks to past periods of accelerating prices in the REBGV area for answers. This analysis is not a forecast, but rather an examination of what trajectory home prices have typically followed after previous periods of rapid acceleration. Click here to view report
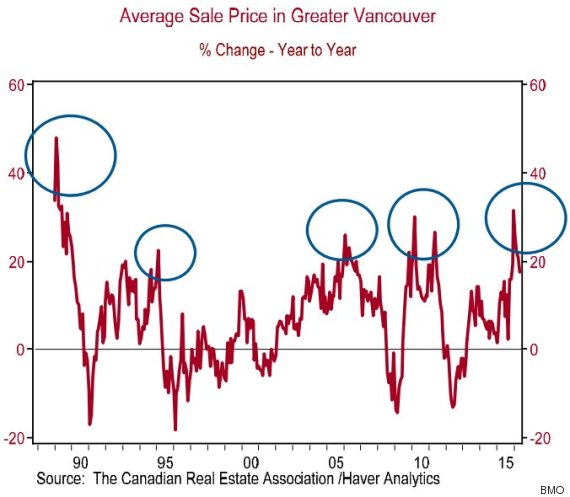
BMO released a chart June 21, 2016 showing that rising house prices are nothing new in the West Coast city.

It shows that prices saw a massive spike in the late 1980s, only to plummet years later — dwarfing any increases that happened in recent years.
“So much has been written about Vancouver’s zany house prices that one might think the current situation is unprecedented,” economist Sal Guatieri wrote.
“But a longer term lens shows the city is no stranger to outlandish price increases that are usually followed by short-term corrections.”


